
- 询价
- ASI
- SpectraView
- 以色列
- 2026年04月18日

企业认证

万千商家帮你免费找货
0 人在求购买到急需产品
- 详细信息
- 询价记录
- 文献和实验
- 技术资料
- 供应商:
宇北医疗

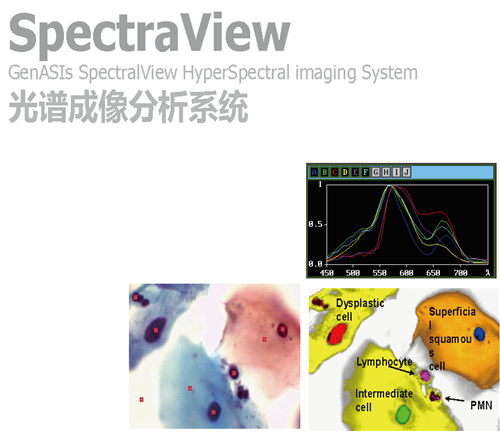
SpectraView光谱成像分析系统
SpectraView光谱影像核心技术(HyperSpectral Imaging) 是先进的结合 影像 ( Imaging ) 与 光谱 ( Spectral ) 的技术, 此技术将撷取的影像,通过干涉仪 ( Interferometer ) 以傅立叶变换处理, 读出影像中每一组成像素的光谱, 经此运算处理, 因为是读取分析光谱, 所以, 可以用光谱方式分辨出一般摄影机或眼睛无法分辨的影像颜色, 可以分辨出影像中任何细微差异的组成.
SpectraView 系统, 可以架设在显微镜上, 或者, 直接接上相机镜头 ( Macro lens ).
详细说明


 SpectraView Capabilities and Features
SpectraView system incorporates three modules, each having extent and unique capabilities:
- Database, to manage projects or patient data and imaging information
- Spectral Capture Module for a single click capture of hyper-spectral image in the visual and NIR
- Spectral Analysis Module with powerful capabilities in the spectral as well as spatial domain
Database – Case Data manager (CDM)
CDM is ASI’s database for managing the data and imaging information that is extracted while working with the system. Its multi-language capabilities make it suitable either for general research as well as for clinical patient information. For general research projects, CDM manages the project’s flow and enables multiple researchers to work on their shared or individual research tasks.
CDM is specially suited for microscopic applications, handling cases, slides and cell information with multiple options for viewing case results in tables and gallery, making comparison between cases /slides, creates reports and more.
Spectral Capture - Interferometer based hyper-spectral imaging
| Feature |
Details / Benefits |
| Spectral range: 400-1000nm |
Full coverage of the visual range (400-700nm) as well as NIR till 1000nm in a single system, single capture. Nuance does not capture the deep blue region (below 420nm) which is part of the visual range. |
| Spectral resolution of 6nm at 400nm |
Nuance of CRI has 20nm or 40nm per channel (depend on system ordered). This is more than three times better than Nuance |
| User defined spectral resolution. |
Optimized spectral details and signal quality |
| Polarized insensitive |
Nuance from CRI is based on a LCTF that is sensitive to polarization, and blocks 50% of regular light |
| High transmission efficiency |
Sensitive and derive good SNR even with faint fluorescence samples. Nuance has only 4% transmission at 420 blue (2% for non-polarized light) |
|
full spectral range is used for Live view |
Focus and image view represents full image data. Also, the intensity of the entire spectrum enables faster and more relevant focus. (Nuance focus must be done at a specific narrow filter that does not represents the entire image and transfers limited light intensity) |
| 16 bit spectral image layers |
Higher accuracy in quantitative image representation |
| Dual mode system to capture both Imaging and Hyper-spectral Imaging |
Direct light (all colors, non-filtered) image capture can be used as a reference image. In addition, filter based applications exists using the “direct imaging mode”. |
| Exposure time from 1mSec-10sec |
Large exposure per frame. Enables capture strong and faintest signals. |
Spectral Analysis
SpectraView includes a general hyper-spectral image analysis module to address wide range of applications; however, it was mostly designed to address needs in microscopy and cell biology. To answer those needs, both morphological and spectral capabilities have been combined in a unique way to enable cell-based analysis. The following lists just few of the many capabilities of SpectraView.
| Feature |
Details / Benefits |
| Enables all imaging modes:Transmittance, Fluorescence,Reflection |
Supports both brightfield and fluorescent applications of all types |
| Graphical representation of spectra:
|
Informative spectral display to show relevant data and be valid for publication as normalized spectra. |
| Spectral un-mixing in brightfield as well as in fluorescence |
Extracting quantitative per pixel information on molecular/stain content |
| Reveals “unexpected”cells/objects within the image |
Dedicated image to show elements that have different spectrum than expected. Critical for various research applications. |
| Auto cell segmentation to identify cells and their nuclei. Performed also on spectral un-mixed images |
Unique segmentation power is achieved by performing it on single un- mixed dye. E.g.: Hx (brightfield) or DAPI (fluorescence) can be used to identify the nuclei without the disturbance or overlapping dyes. |
| Advanced cell classification based on morphological and spectral data simultaneously. |
Unique capability. Enables to classify cells to multiple pre-defined classes based on their shape and spectral characteristics (like IHC content). |
| Statistics table summarizing how many cells of each type were found |
Immediate score of cells, for multiplex IHC staining and more |
| Background removal (uniform or non-uniform!) |
Visualize the image without un-needed background effect |
| Multiple mathematical operations between cubes, images and spectra. |
Enables endless needs, including accurate normalization of spectra within the scene, cover for non-uniformities in microscope illuminations, background manipulation and more. |
| Load multiple cases/images simultaneously |
Enables fast comparison between different regions, samples, preparations |
| Endless display options to show extracted single un-mixed layers, any subset of layers, classified cells, cell contours, spectral integration over specific range, spectral graphs and more. |
Enables visualize the data in a simple and informative way. Paper-ready images and spectral graphs. |
风险提示:丁香通仅作为第三方平台,为商家信息发布提供平台空间。用户咨询产品时请注意保护个人信息及财产安全,合理判断,谨慎选购商品,商家和用户对交易行为负责。对于医疗器械类产品,请先查证核实企业经营资质和医疗器械产品注册证情况。
- 作者
- 内容
- 询问日期
 文献和实验
文献和实验来,我们将通过详细解读一线肿瘤免疫学家的最新发表文章中研究进展,结合多标记免疫荧光染色,多光谱成像和定量分析系统,为您深度解析 PD-L1 在肿瘤微环境中的表达谱,及其在胃癌 & 肝癌治疗中的研究意义及临床应用价值。郑利民教授团队将 453 个肝癌病人的活检样品,制作成肿瘤组织芯片(Tissue Microarray, TMA),并使用多标记酪胺信号放大 (Tyramide Signal Amplication, TSA)技术,对肿瘤组织芯片中的 PD-L1 和 6 种免疫细胞标志物 CD68 /CD33/CD
 技术资料
技术资料暂无技术资料 索取技术资料