Cell cycle analysis of Escherichia coli cells
互联网
Cell cycle analysis of Escherichia coli cells
C period = the time for a round of chromosome replication
D period = the time between the end of a round of chromosome replication and cell division
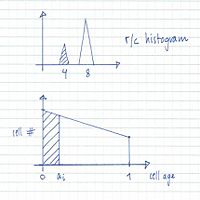
Determination of initiation age (ai ) and C+D:

From flow cytometry analysis of cells treated with rifampicin and cephalexin (run-out histogram) the proportions of cells that had not initiated replication at the time of drug action (4-origin-cells, streaked) and cells that had initiated (8-origin-cells) can be estimated.The initiation age (ai ) can be found from the theoretical age distribution described by this formula,

where F is the fraction of cells that had not initiated and τ is the generation time, or from the estimated graph of the theoretical age distribution (streaked portion).
This gives:

If you have for example a generation time τ=84 minutes and the portion of cells with 4 origins is 66% the formula gives:

The C+D period is estimated from the initiation age (ai ), the generation time (τ) and the number of generations spanned per cell cycle.
Example:

4-origin-cells: 23 %
Generation time (τ): 27 min
Initiation age (ai ): 5 min

Determination of the C and D periods:
oriC/ter ratio determination ) and the generation time (τ):

The D period is found from the C+D and C period:
D = (C + D ) − C
Example (continues):
C period calculated from the oriC/terC ratio: 49 min
D period = (C+D) � C
D period = 76 min � 49 min = 27 min

The theoretical exponential DNA histogram:
A theoretical exponential DNA histogram can be drawn to check whether the obtained values fit with the experimental data. From the C+D period the DNA content of the cells at different time points in the cell cycle can be calculated.


The individual values of C and D can be varied
to obtain a shape of the theoretical histogram
that gives the best fit to the experimental histogram.
Calculation of the average number of replication forks when D=τ:
In the example given above, 23% of the cells contain 4 replication forks (4-origin peak in run-out histogram) and 77% contain 12 replication forks (8-origin peak), hence the average number of replication forks in the cell population will be:
(4 x 0.23) + (12 x 0.77) = 10.2 forks
Calculation of the average number of replication forks when D≠τ:

12 forks → 8-origin peak in run-out histogram = 77% of the cells
6 and 4 forks → 4-origin peak in run-out histogram = 23% of the cells
The fraction of cells containing 6 forks: F = 2 - 2((τ-at )/τ) = 2 � 2((27-2)/27) = 0.10
The fraction of cells containing 4 forks: 0.23 � 0.10 = 0.13
The average number of replication forks: (6 x 0.10) + (4 x 0.13) + (12 x 0.77) = 10.4 forks