
大家都在搜


After you’ve scaled the density of the protein of interest for each sample to the standard sample, and adjusted the relative density based on the loading-control band, you are left with an estimate of the relative density of the protein of interest in each lane on your gel (relative to the standard in lane 1). Repeat this for each separate gel. When finished, you’ll note that because every sample lane is normalized to the standard sample in Lane 1 on that particular gel, and every gel contains the same standard sample, your cross-gel comparison is already accomplished, since every sample is now normalized to the same standard sample (Figure 22).

After all of this work, you’re left with (adjusted) Relative Densities for each of your samples (the yellow cells in Figure 22). At this point you can ignore the values of the standard samples, since you only needed those to ensure that your cross-gel comparisons were scaled properly. Now you can finally begin calculating average relative density values for your experimental control samples (maybe these are samples 3+6) and your experimental treatment samples (perhaps these are samples 1+4 and 2+5) to carry out the real comparison of protein expression under your treatment conditions. Because your relative density values are all normalized to the standard sample, you may wish to eventually re-scale your relative density values once again using your experimental controls’ average value as a baseline.
A few extra details:
With regard to the ImageJ gel analysis routine, there has been some question of what the values reported by ImageJ correspond to. The images below may help illustrate what Image-J is measuring.

In Figure 25 above, I have drawn out a set of fake “bands” in Adobe Illustrator. The gray value and area of each band are listed above the band (in this case a lower pixel value = darker band). Additionally, I have included the “area” value returned by Image-J after plotting the bands and clicking in each peak with the Wand tool. Note that these “area” values are a RELATIVE measure of the size and density of each peak you clicked with the wand tool. When you halve the area of a band, but maintain the same gray value (compare lanes 1+2), the value reported by ImageJ is half as large. By the same token, if you halve the gray value but maintain the same area (compare lanes 1+5), the value reported by Image-J is halved.
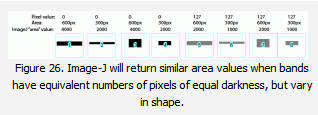
The same holds true for bands of different shapes. In Figure 26 above, altering the shape of the band, but maintaining the same gray value and area (compare lanes 1+3) yields an equivalent value from ImageJ.
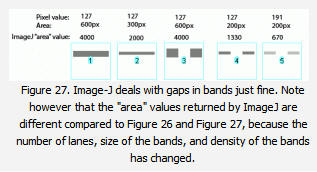
Image-J also accounts for gaps in a band, as shown in Figure 27 above. Compare lanes 1+3, which both have an equal number of gray pixels and equal gray values (i.e. equal amounts of protein on the gel). ImageJ reports the same “area” value for both of these lanes.
It is worth reiterating that the “area” values and percentages reported by Image-J are always relative to the total size and density of bands that you have selected in a particular image. In the image immediately above, the band in column 1 returns an “area” value of 4000, while in the previous two images column 1 had the same size band, but with twice the gray value, which in both cases also returned a value of 4000. The raw values returned by Image-J are meaningless for comparing across different gels, since they are only a relative measure of the bands you’ve highlighted on a particular gel image. This is why we need to standardize to some common standard loaded onto all of the gels.
Additional references – The methods outlined here are by no means canonical and there are plenty of subtleties to be considered in this sort of analysis. For more practical considerations of scanning and analyzing gel images, see the following papers:
Gassmann, M., Grenacher, B., Rohde, B. and Vogel, J. (2009). Quantifying western blots: pitfalls of densitometry. Electrophoresis 30, 1845-1855. doi: 10.1002/elps.200800720
Tan, H. Y. and Ng, T. W. (2008). Accurate step wedge calibration for densitometry of electrophoresis gels. Optics Communications 281, 3013-3017. doi: 10.1016/j.optcom.2008.01.012

更有优质直播、研选好物、福利活动等你来!

我的询价
询价列表

暂时没有已询价产品
手机验证