
大家都在搜

| 接上篇继续为大家介绍用R语言的ComplexHeatmap包绘制热图~ 设置标题 Heatmap(mat, name = "legend") 
Heatmap(mat, heatmap_legend_param = list(title = "legend")) 你可以设定热图的行与列标题,行与列图形参数分别通过row_title_gp和column_title_gp选项指定,使用gpar()函数进行具体的设置。 Heatmap(mat, name = "foo", column_title = "X", row_title = "Y")  Heatmap(mat, name = "foo", column_title = "HAHAHA", column_title_gp = gpar(fontsize = 20, fontface = "bold"))  标题的选择可以使用row_title_rot和column_title_rot设置,但只支持水平和垂直旋转。 Heatmap(mat, name = "foo", row_title = "Le", row_title_rot = 0)  聚类 聚类是热图可视化的关键特征之一。该包支持高度灵活的聚类设定。 首先有一些聚类的通用设定,例如是否显示树状图、大小。 Heatmap(mat, name = "foo", cluster_rows = FALSE, show_column_dend = FALSE)  Heatmap(mat, name = "foo", column_dend_height = unit(2, "cm"))  有3种方式指定聚类的距离度量:
Heatmap(mat, name = "foo", clustering_distance_rows = function(m) dist(m)) Heatmap(mat, name = "foo", clustering_distance_rows = function(x, y) 1 - cor(x, y)) Heatmap(mat, name = "foo", clustering_distance_rows = function(x, y) 1 - cor(x, y))  基于这个特征,我们开源使用配对距离应用聚类使得可以鲁棒地处理异常值。 mat_with_outliers = mat for(i in 1:10) mat_with_outliers[i, i] = 1000 robust_dist = function(x, y) { qx = quantile(x, c(0.1, 0.9)) qy = quantile(y, c(0.1, 0.9)) l = x > qx[1] & x < qx[2] & y > qy[1] & y < qy[2] x = x[l] y = y[l] sqrt(sum((x - y)^2)) } Heatmap(mat_with_outliers, name = "foo", col = colorRamp2(c(-3, 0, 3), c("green", "white", "red")), clustering_distance_rows = robust_dist, clustering_distance_columns = robust_dist)  如果提供了距离方法,你也可以对字符串矩阵进行聚类。cell_fun参数会在后面进行解释。 mat_letters = matrix(sample(letters[1:4], 100, replace = TRUE), 10) # distance in th ASCII table dist_letters = function(x, y) { x = strtoi(charToRaw(paste(x, collapse = "")), base = 16) y = strtoi(charToRaw(paste(y, collapse = "")), base = 16) sqrt(sum((x - y)^2)) } Heatmap(mat_letters, name = "foo", col = structure(2:5, names = letters[1:4]), clustering_distance_rows = dist_letters, clustering_distance_columns = dist_letters, cell_fun = function(j, i, x, y, w, h, col) { grid.text(mat_letters[i, j], x, y) }) 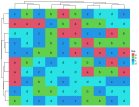 创建层次聚类的方法可以通过选项clustering_method_rows和clustering_method_columns指定,可以使用hclust()函数支持的方法。 Heatmap(mat, name = "foo", clustering_method_rows = "single")  默认,聚类由hclust()实施。但你可以通过cluster_rows或cluster_columns指定由其他方法生成的hclust或dendrogram对象。在下面的例子中,我们使用来自cluster包的diana()和agnes()函数进行聚类。 library(cluster) Heatmap(mat, name = "foo", cluster_rows = as.dendrogram(diana(mat)), cluster_columns = as.dendrogram(agnes(t(mat))))  自定义热图主体 rect_gp参数提供了热图主体的基本图形设置。 Heatmap(mat, name = "foo", rect_gp = gpar(col = "green", lty = 2, lwd = 2)) 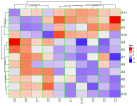 热图主体可以自定义。默认热图主体由带不同填充色的矩形数组组成(这里称为cell)。如果rect_gp中的type设置为none,整个cell数组被初始化但没有图形,然后用户可以通过cell_fun自定义他们自己的图形函数。cell_fun应用于热图的每一个cell,它需要为每一个cell提供下面的信息: j - 矩阵中的列索引 i - 矩阵中的行索引 x - cell中心点的x坐标 y - cell中心点的y坐标 width - cell的宽度 height - cell 的高度 fill - cell的填充色 最常见的使用是给热图添加数值信息。 Heatmap(mat, name = "foo", cell_fun = function(j, i, x, y, width, height, fill) { grid.text(sprintf("%.1f", mat[i, j]), x, y, gp = gpar(fontsize = 10)) })  同样用R语言,也能利用ComplexHeatmap包画出这么漂亮的热图,这下生信小白也能画了。敬请关注下一期文章,将继续为你揭晓更多可用的工具。 |

更有优质直播、研选好物、福利活动等你来!