


Cayman Chemical Company,Inc.
入驻年限:4 年
- 联系人:
Kristina Whitfield
- 所在地区:
美国
- 业务范围:
试剂、抗体、细胞库 / 细胞培养、ELISA 试剂盒
- 经营模式:
生产厂商
推荐产品


公司新闻/正文
A Quick Glance at Competitive ELISA Performance Characteristics & Validation
人阅读 发布时间:2023-12-15 14:48
Enzyme-linked immunosorbent assays (ELISAs) are a powerful tool for the detection and quantification of target analytes in biological samples. Validation of an assay ensures that the ELISA accurately quantifies a target analyte and is robust, reliable, and reproducible. It also defines key ELISA performance metrics.
Overview of a Competitive ELISA
Competitive ELISAs are the preferred option for small molecules, such as lipids, steroids, or peptides, that are difficult to immobilize on the solid phase as well as for target analytes that may only have a single epitope. They are often simpler and faster than other ELISA formats because there is typically only one incubation step.
To detect a target analyte with a competitive ELISA, native analyte in biological samples competes with an enzyme-labeled analyte (tracer) for a limited amount of specific antibody that is immobilized on the plate. The signal intensity is proportional to the amount of tracer occupying the antibody binding sites, and therefore, inversely proportional to the concentration of sample target analyte. This difference in absorbance is normalized to the maximum absorbance of the tracer in the absence of free analyte (B0) and is represented as a ratio B/B0.
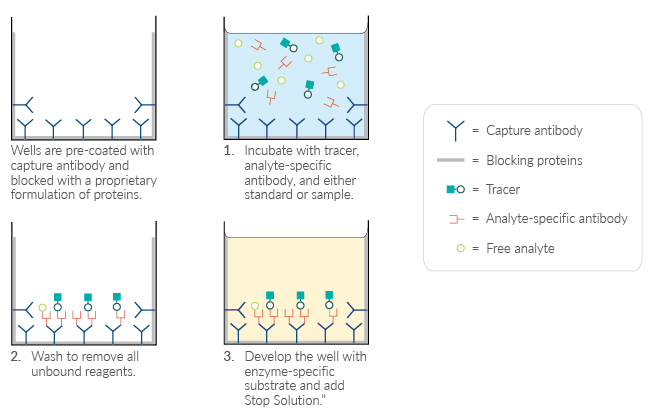
Figure 1. Schematic of a competitive ELISA.
Key Competitive ELISA Performance Metrics
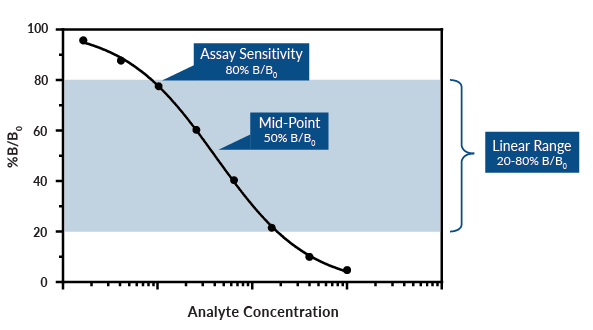
Figure 2. Sample competitive ELISA standard curve. The schematic above is a theoretical example and does not represent a specific ELISA. Remember that in competitive ELISAs, there is an inverse relationship between analyte concentration and signal intensity. Samples with lower analyte concentrations produce HIGHER absorbance values, and vice versa.
Assay Range: The range between the concentration of the highest standard and the concentration of the lowest standard. Samples may have to be diluted or concentrated to fall in range of the standard curve.
Linear Range: The most reliable portion of the standard curve for sample analysis, which typically resides between 20-80% B/B0 (signal/maximum signal). Exercise caution when analyzing data outside of these boundaries, as a small change in absorbance can represent a large change in analyte concentration.
Mid-Point: The concentration at which 50% of maximum binding (50% B/B0) is achieved.
Lower Limit of Detection (LLOD): The lowest level of analyte that can be detected (but not necessarily quantified) with reasonable certainty above background signal. The LLOD is defined as a concentration two standard deviations higher than the mean zero value.
Sensitivity: Cayman defines sensitivity as 80% B/B0. Because the linear range is typically between 20-80% B/B0, 80% binding is the minimum level where reliable, reproducible data can be obtained.
This is different from many assay suppliers who define assay sensitivity as the LLOD. The LLOD is typically not reliable and may reside at a concentration below the standard curve. Simply put, this value typically lies below an assay's functional range, and results that fall outside of the linear range should be interpreted cautiously.
Cayman Provides a Truer Measure of ELISA Sensitivity
To give researchers a truer measure of ELISA sensitivity, Cayman defines the sensitivity of our ELISAs differently from most assay suppliers.
Competitive ELISA Sensitivity Summary |
||
| Cayman | Other Assay Suppliers | |
| Reported Sensitivity |
The lower limit (80% B/B0) of the linear range of the standard curve |
LLOD, which typically lies below an assay's range |
| Why It Matters |
The minimum level of analyte where reliable, reproducible data can be obtained |
The lowest level of analyte that can be detected (but not quantified) above background signal with reasonable certainty |
| Cayman provides researchers with both the 80% B/B0 value and the LLOD along with the assay's high-low range and 50% B/B0 mid-point to further qualify the ELISA. | ||
Other Key Performance Metrics
Specificity: The ability of the specific antibody in the assay to distinguish the target analyte from closely related molecules. Cayman reports specificity as percent cross-reactivity.
Biomolecules that possess similar epitopes to the analyte can compete with binding to the primary antibody, reducing the specificity of the assay for the target analyte. During validation, Cayman tests specificity by performing the assay against a panel of closely related substances (i.e., potential cross reactants).
Precision: The coefficient of variation (CV) is a measurement of the consistency between sample replicates.
-
Intra-assay Precision: A measure of the variation of sample replicates run on the same plate.
-
Inter-assay Precision: A measure of the variation of sample replicates run across different plates over the course of several days to assess plate-to-plate consistency.
Cayman reports intra- and inter-assay CV values of calculated concentrations while many other assay suppliers report CV values of absorbance. As a result, Cayman's ELISAs may appear more variable. However, calculating variability of concentrations gives a more accurate representation of an ELISA's precision.
Experiments to Evaluate ELISA Performance
ELISAs can be used for several biologically relevant sample types. Sample matrices are complex and may contain not only the analyte of interest, but also other substances that may be structurally similar and cross-react or cause interference in the assay.
At Cayman, we test multiple sample matrices within several validation experiments, including spike and recovery, linearity, and parallelism. We develop and provide purification protocols as needed to detect and measure the target analyte in matrices that interfere in the assay.
Spike and Recovery
Spike and recovery experiments determine the accuracy of the ELISA. In these experiments, known quantities of a target analyte are spiked into the sample matrix, which ideally contains either no or low amounts of the analyte. The samples are diluted with assay buffer and analyzed using the ELISA. If there are considerable differences (>20%) between the expected concentration (i.e., the spiked concentration) and the measured concentration (i.e., the recovered concentration), this could indicate the presence of an assay interferent.
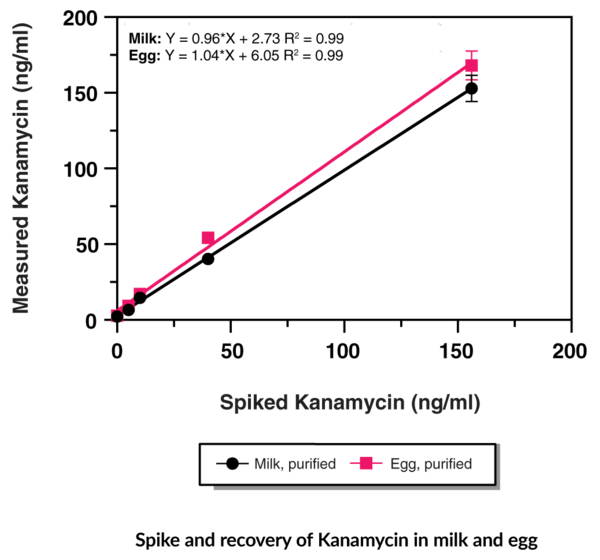
Figure 3. Spike and recovery of kanamycin in milk and egg using the Kanamycin ELISA (Item No. 502370). This data is shown as a representative example. Spike and recovery for other Cayman ELISAs may be found in the kit booklet accompanying each ELISA.
Dilutional Linearity
A dilutional linearity experiment confirms that the ELISA is reliable over a range of dilutions. These experiments determine if an analyte present in a sample at concentrations above the upper limit of quantitation (ULOQ) can be accurately measured when diluted to fall in range of the standard curve.
A dilutional linearity experiment is performed with spiked or endogenous samples containing analyte concentrations above the ULOQ. The samples are assayed in the ELISA at multiple dilutions and evaluated for linearity by adjusting the calculated concentration for the dilution factor to obtain the sample concentration. If the samples dilute linearly, this indicates that the assay is accurate across various dilutions. This is critical, as it is often the case where one is evaluating samples that require a wide range of dilution to fall within the linear range of the standard curve.
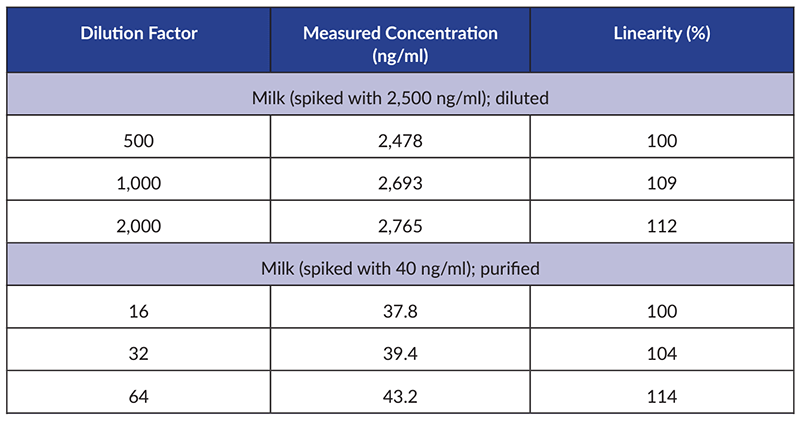
Figure 4. Dilutional linearity of kanamycin in various matrices using the Kanamycin ELISA (Item No. 502370). This data is shown as a representative example. Dilutional linearity for other Cayman ELISAs may be found in the kit booklet accompanying each ELISA.
Parallelism
While dilutional linearity provides information on samples containing target analyte values above the ULOQ, parallelism confirms that the native analyte in the sample matrix and the reference standard are immunologically similar. That is, parallelism experiments show that native analytes and reference standards are recognized equally by the antibodies in the ELISA. This is critical, as accurate quantification of a target analyte in a biological sample is dependent on the immunoreactivity of the reference standard.
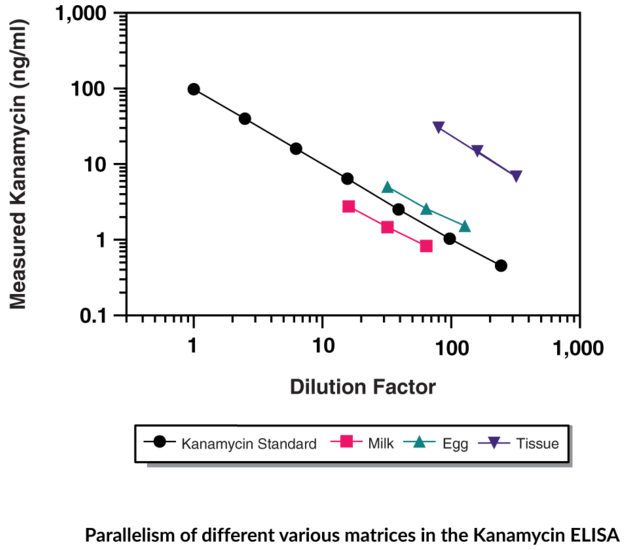
Figure 5. Parallelism of different various matrices in the Kanamycin ELISA. This data is shown as a representative example. Parallelism for other Cayman ELISAs may be found in the kit booklet accompanying each ELISA.
Reference standards can be biomolecules that may not be fully representative of their form in a biological state. This can lead to discrepancies in how well the specific ELISA antibody immunologically recognizes the two, and thus, impedes the accurate quantification of native analytes.
Parallelism also can indicate interference from the sample matrix in the ELISA. There are several potential interferents that could contribute to different concentration-response relationships between reference standards in assay buffer and native analytes in sample matrices (Figure 6). An assay buffer is a simplified surrogate matrix – it does not contain potential cross-reactants or other interferents that could lead to inaccurate results.
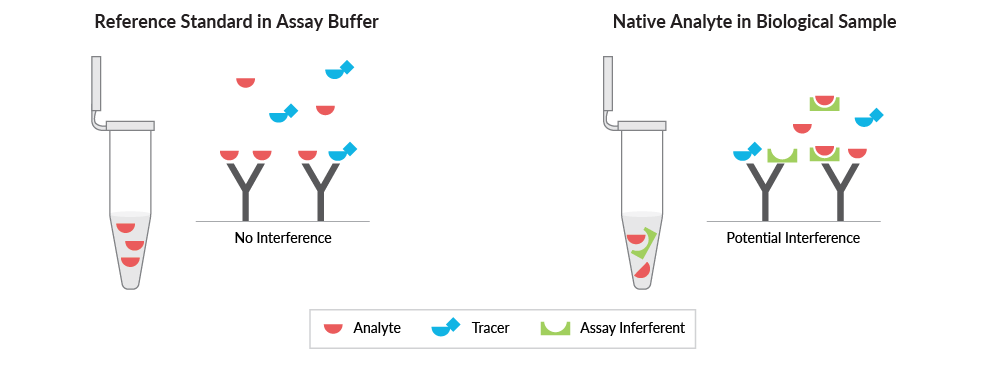
Figure 6. There are many sources of assay interference in biological samples that are not present in the reference standard or assay buffer. This could lead to discrepancies in the ability of the ELISA to accurately quantify the endogenous target analyte.
Parallelism experiments are performed by comparing the concentration-response curve of native samples with the concentration-response curve of the reference standard across a range of dilutions. The measured concentration is plotted as a function of dilution for both the native analyte in sample matrices and reference standards. If the concentration-response curves are parallel, this indicates that the selected reference standard is appropriate for the accurate quantification of the native analyte.
Sample Purification Reduces Matrix Interference
Matrix interference can be observed as an unexpected increase or decrease of signal intensity or a lack of correlation between dilutions. Sometimes matrix interference can be eliminated by determining a minimum required dilution (MRD), which dilutes the interferent enough such that it no longer contributes any notable assay interference. Other times, it is necessary to perform a sample purification procedure to reduce or eliminate these assay interferents. Sample purification procedures, if necessary, are made available in the kit booklet for each ELISA.
Validation of Untested Sample Types
Biological samples can be highly variable in their composition, and as a result, the potential interferents can also be variable. If your sample type has not been evaluated during our validation testing, it is uncertain if the ELISA will perform within the specifications outlined in the kit booklet. It is recommended that the end user performs their own validation experiments with their sample matrix of interest prior to assaying study samples.
Cayman ELISA Kits
Cayman offers hundreds of validated and ready-to-use ELISA kits. They contain all reagents required to perform the ELISA as well as complete details on pre-assay preparation steps, assay protocol, analysis, and performance characteristics.
Technical Support
At Cayman, we strive to support our customers in their research. Our Technical Support scientists are available for each step of your research, from help with selecting an ELISA to assisting with data analysis or troubleshooting after the ELISA is performed.
Custom Solutions
Custom Assay Development Services
Along with our extensive collection of commercial assays, Cayman offers custom assay development services. We can support projects from custom assay design, development, and optimization through validation and manufacturing.
Bioanalysis Services
Cayman offers a full suite of bioanalytical techniques to support projects needing biomarker discovery, compound or activity screening, or biological sample analysis services. We can support projects ranging in scope from running or optimizing a single assay to building a comprehensive biomarker discovery and development program with our numerous in-house capabilities and core facilities.
询价列表

暂时没有已询价产品
